flights = sns.load_dataset("flights")

sns.lineplot(x="year", y="passengers", data=flights)
plt.show()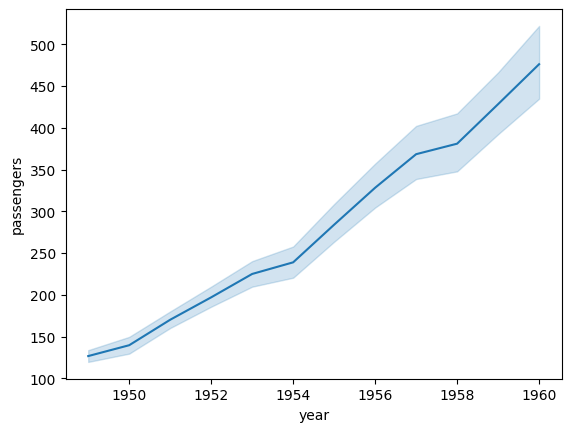
Use Cases of Seaborn:
Seaborn is widely used for statistical data visualization in various fields. Its ability to create beautiful, insightful, and easy-to-understand graphs makes it an essential tool for data analysis. Below are some key use cases:
📌 Example: Visualizing relationships in the Titanic dataset.
Use Case: Helps data scientists understand correlations, detect outliers, and analyze distributions in large datasets. import seaborn as sns import matplotlib.pyplot as plt
titanic = sns.load_dataset(“titanic”)
sns.pairplot(titanic, hue=“survived”) plt.show()
📌 Example: Sales trends over time. Use Case: Used in financial analytics, stock market analysis, and trend forecasting.
flights = sns.load_dataset("flights")
sns.lineplot(x="year", y="passengers", data=flights)
plt.show()
📌 Example: Understanding relationships in ML datasets.
Use Case: Helps feature selection, model evaluation, and visualizing predictions.
iris = sns.load_dataset("iris")

sns.pairplot(iris, hue="species")
plt.show()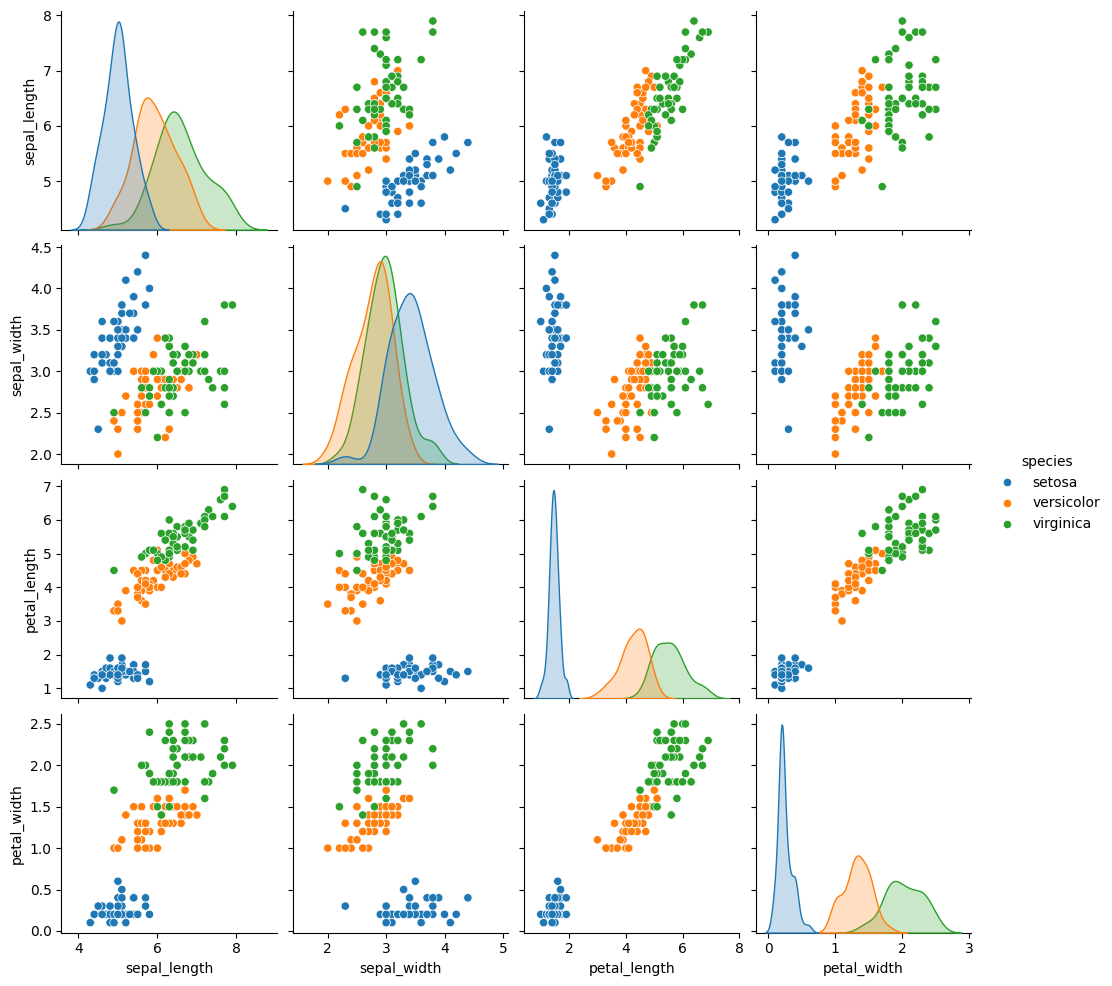
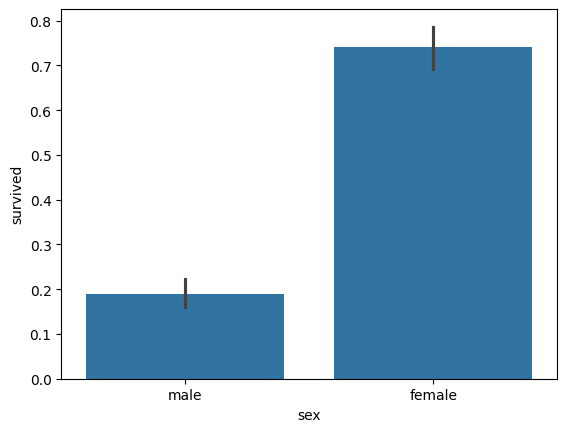
📌 Example: Gender-wise survival rates in Titanic dataset
Use Case: Used in government reports, sociology, and market research.
sns.barplot(x="sex", y="survived", data=titanic)
plt.show()